
In this tutorial, we will create a Choropleth map (map that shows statistical information with different shades of a color).
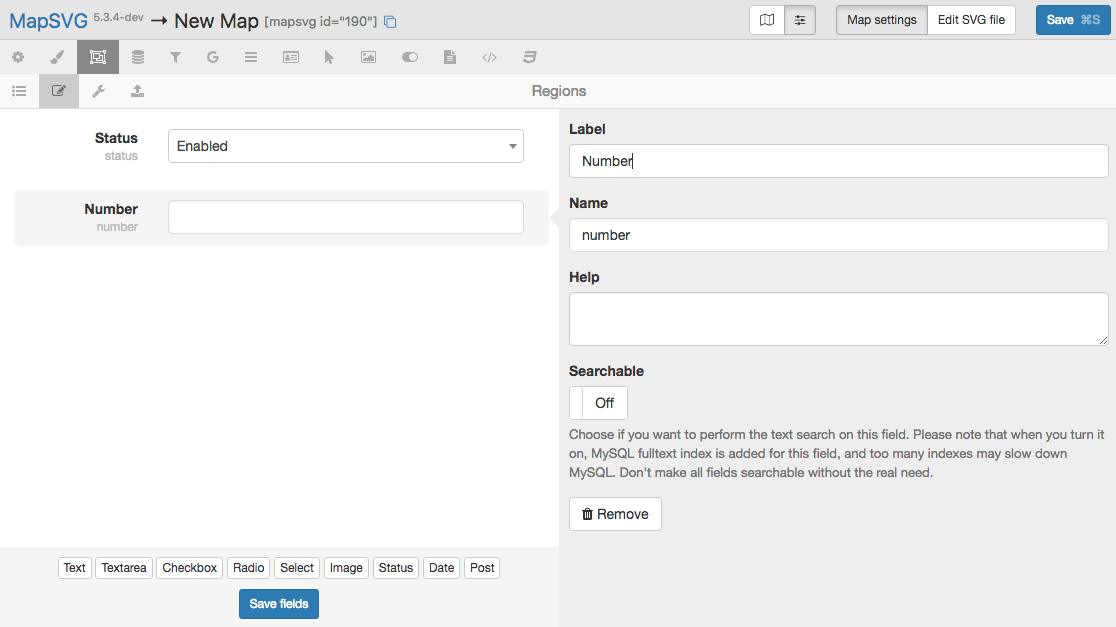
Create a new map and go to Toolbar / Database / Edit fields. Add a new Text field. We named the field "number" but you can give it any other name:
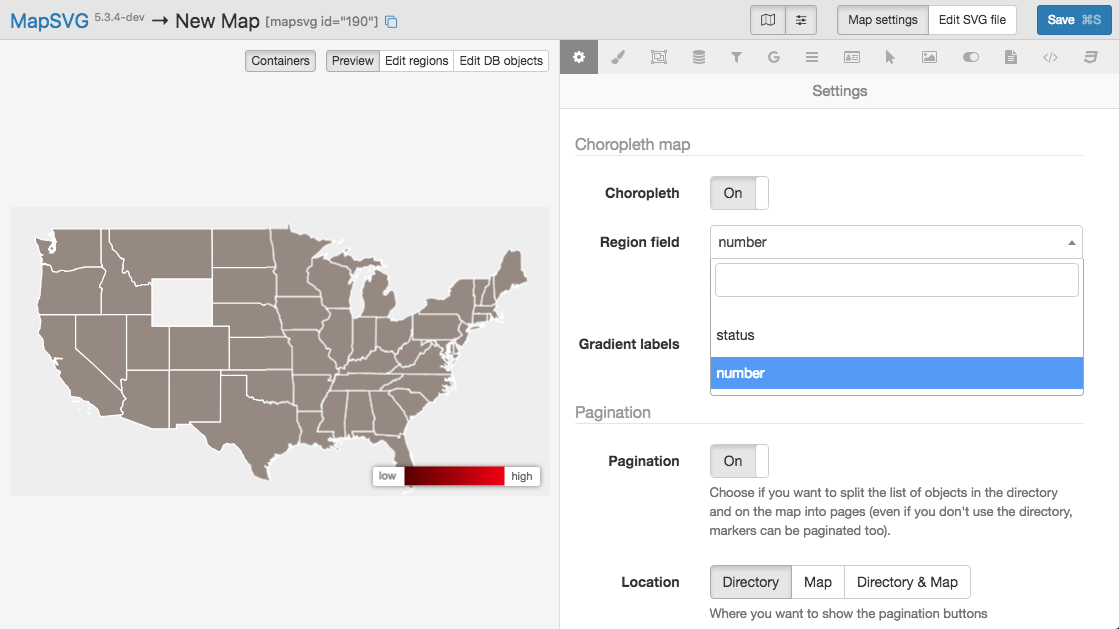
Now turn on the Choropleth map - Toolbar / Settings / Choropleth: On and choose the field that you've created earlier from the Region field drop-down list:
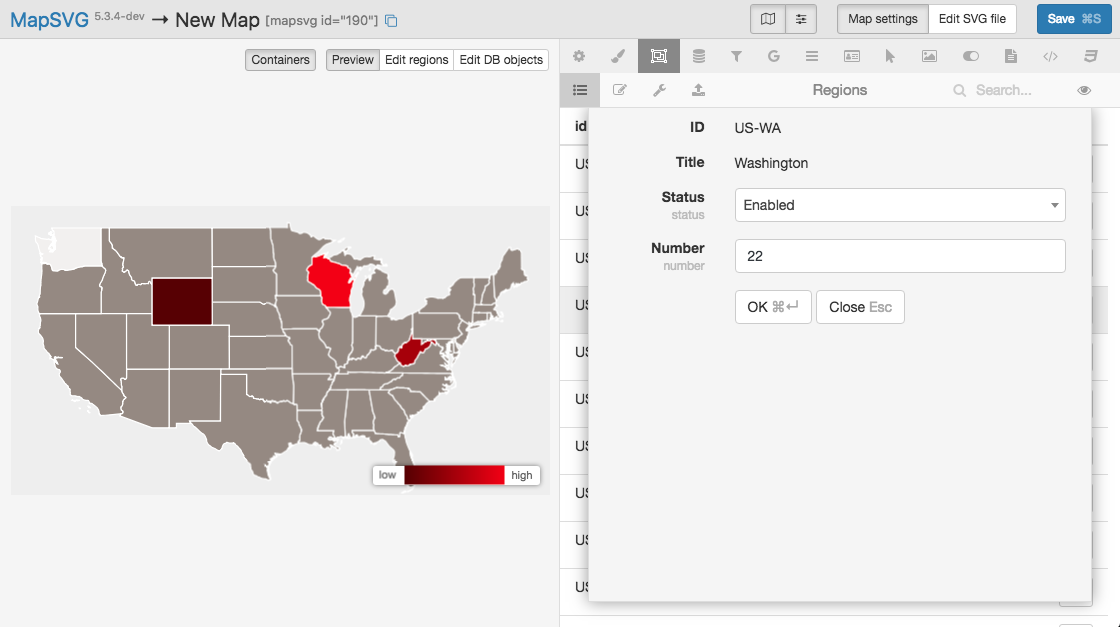
A gradient appears at the bottom of the map but region colors didn't change yet because we didn't add any values to the "number" field. Let's do that. Go to Toolbar / Database / List. Click on Regions in the table and enter numbers into the "number" field. When you add numbers for several regions - the colors of regions on the map start to change:
You can customize the colors of regions in the Toolbar / Colors tab and change "low/high" labels in Menu / Settings / Choropleth / Gradient labels.